How to read your website analytics without a translator

Analytics dashboards fail most business owners the same way: too many numbers, no sentences. But behind the charts, your analytics are only ever answering four questions. Learn the four and you can read any dashboard — including the one we give every client.
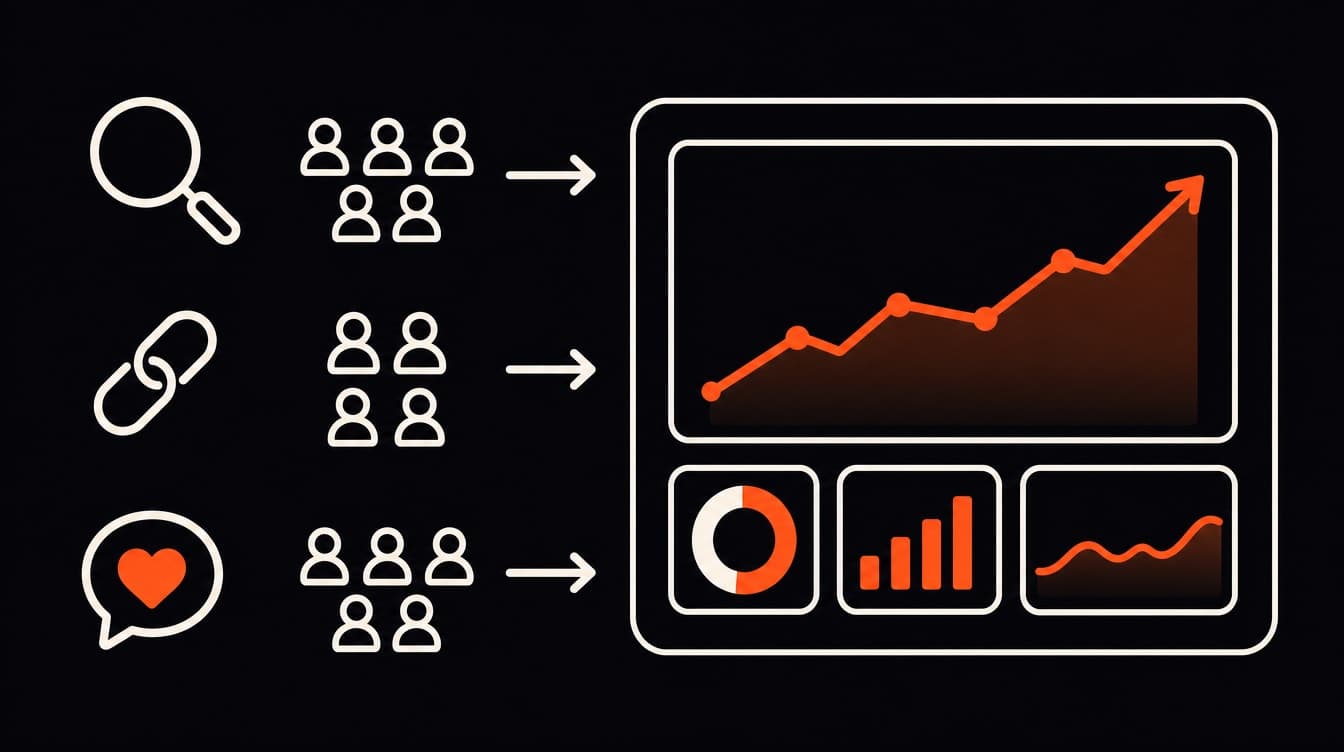
Question 1: how many people came?
'Visitors' (or 'users') counts people, not clicks. One person viewing five pages is one visitor. Watch the trend, not the raw number — 300 visitors means little on its own; 300 after 200 last month means everything.
Question 2: where did they come from?
Sources split your visitors into: search (they looked for something and found you), direct (they typed your address — brand strength), social, and referral (another site linked to you). Each source growing tells a different story about what's working.
Questions 3 and 4: did they care, and did they act?
- Engagement: did they stay, scroll, visit a second page — or bounce in seconds? Weak engagement usually means the page didn't match what they expected.
- Conversion: did they do the thing — call, book, send the form? This is the only number that pays invoices. Everything else exists to explain it.
A good report doesn't show you more numbers. It tells you which of the four answers changed, and why.
This is why our client dashboard shows exactly these four things with a plain-language sentence on top — and why the monthly report we send reads like a note from a colleague, not a spreadsheet. Numbers you understand are numbers you can act on.